Visualization at Jülich Supercomputing Centre
Visualization is an important and commonly used methods of analyzing and interpreting data from computing simulations. The Cross-Sectional Team "Visualization" (CST-Vis) at JSC assists users by developing and adapting software tools for visualization of scientific data to meet their special needs.
The research focus of this team is dedicated to remote Big Data and in-situ visualisation on HPC systems through the application and further development of parallel visualisation packages like VisIt and ParaView. This covers the whole process starting from data generation over data post-processing on large supercomputer systems like JUWELS up to image rendering and presentation of results, e.g. on display systems of different scales. Among them are a stereoscopic back projection system and a large scale cylindrical 3D display wall.
Cross-Sectional Team "Visualization"
http://www.fz-juelich.de/ias/jsc/EN/Expertise/Support/Visualization/_node.html
http://www.fz-juelich.de/ias/jsc/EN/Expertise/Support/Visualization/cst-visualization.html
Graphical Login (VNC)
"[...] Virtual Network Computing (VNC) is a graphical desktop sharing system [...] to remotely control another computer. It transmits the keyboard and mouse events from one computer to another, relaying the graphical screen updates back in the other direction, over a network. VNC is platform-independent – there are clients and servers for many GUI-based operating systems and for Java. Multiple clients may connect to a VNC server at the same time." link |
|---|
Jupyter for Interactive Supercomputing
" Jupyter is an interactive computational environment, in which you can combine code execution, rich text, mathematics, plots and rich media in a document called Jupyter Notebook. Jupyter Notebooks are for creating reproducible computational narratives. The Jupyter Notebook is based on a set of open standards for interactive computing. Think HTML and CSS for interactive computing on the web. These open standards can be leveraged by third party developers to build customized applications with embedded interactive computing. The Jupyter Notebook allows you to create and share documents that contain live code, equations, visualizations and narrative text. Uses include: data cleaning and transformation, numerical simulation, statistical modeling, data visualization, machine learning, and much more." link |
|---|
ParaView
"ParaView is an open-source, multi-platform application designed to visualize data sets of varying sizes from small to very large. The goals of the ParaView project include developing an open-source, multi-platform visualization application that supports distributed computational models to process large data sets. It has an open, flexible, and intuitive user interface. Furthermore, ParaView is built on an extensible architecture based on open standards. ParaView runs on distributed and shared memory parallel as well as single processor systems and has been successfully tested on Windows, Linux, Mac OS X, IBM Blue Gene, Cray XT3 and various Unix workstations and clusters. Under the hood, ParaView uses the Visualization Toolkit as the data processing and rendering engine and has a user interface written using the Qt cross-platform application framework." link |
|---|
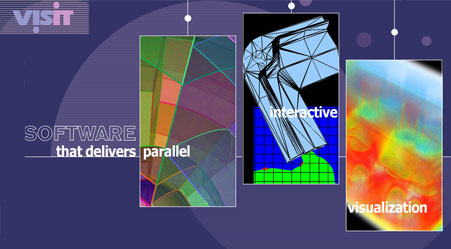
VisIt
"VisIt is an Open Source, interactive, scalable, visualization, animation and analysis tool. |
|---|
Examples of Visualization Workflows
- Animated Movie of Brain Data from Neuroscience using ParaView
- Convert raw data to HDF5, XDMF
- Prototype the movie with the ParaView GUI
- Python scripting to generate the movie with ParaView
- Camera Flights
- Animtion of Opacity Map
- Animation of Volume of Interest
- Animating Data with ParaView Python-Scripting
- Visualization and animating of ERA5 Reanalysis Climate Data using ParaView Python-Scripting
- Visualization and Animating of Data from a Pan European Climate Simulation with the WRF Model using ParaView Python-Scripting
Other Software
- VMD - Visual Molecular Dynamics
- Xpra - Persistent Remote Applications On X
- X.Org
- encoding movies
- Jupyter
- OpenFOAM
CST-Vis Intern
any feedback welcomed - h.zilken@…, j.goebbert@…
Attachments (6)
- ParaView_Catalyst_logos.png (88.7 KB ) - added by 9 years ago.
- xpra-logo.png (6.5 KB ) - added by 8 years ago.
- visit-home.jpg (29.8 KB ) - added by 6 years ago.
- virtualgl.gif (19.0 KB ) - added by 6 years ago.
- jupyter-main-logo.png (60.7 KB ) - added by 6 years ago.
- Jupyter.png (79.3 KB ) - added by 6 years ago.
Download all attachments as: .zip

